This is Chrome’s new Security Overview Panel
Google launched a new Security Overview panel in its Chrome web browser recently which has been designed to provide detailed information about the state if a site's secure connection.
Designed for webmasters, it can be a useful tool for regular Internet users as well as it reveals connection-specific information that make it easier to determine why a site is not showing the green "all secure" icon when connecting to it.
The feature is rolled out in Chrome 48 Beta according to Google but that is somewhat puzzling considering that Chrome Stable is already available as version 48 as well, and that you may find the feature in the stable version already after updating to the latest version of the browser.
Chrome Security Overview
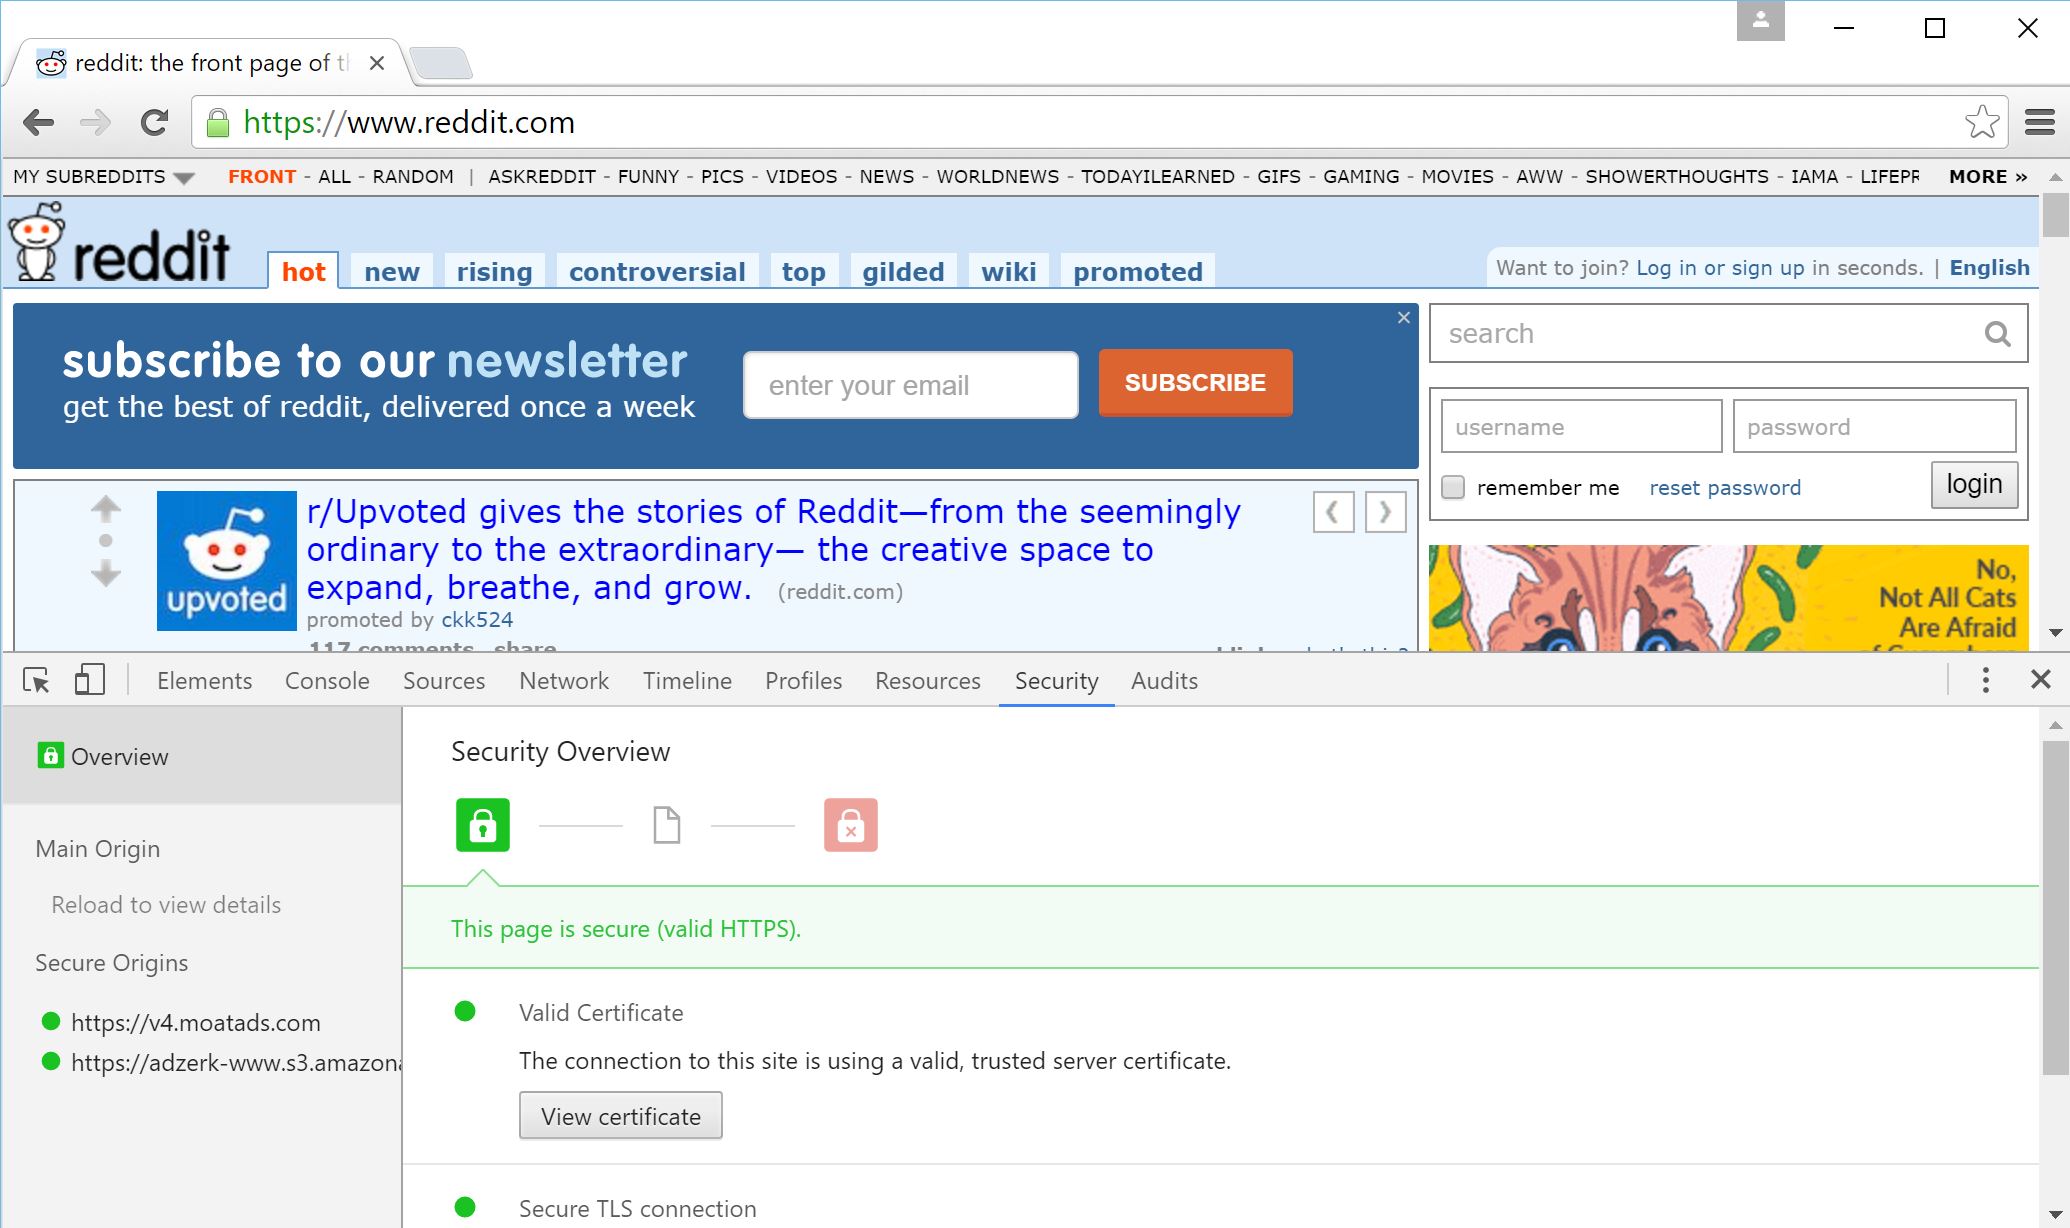
Security Overview is located under the new Security tab in the browser's Developer Tools section.
You may open the new panel with a tap on Ctrl-Shift-i which toggles the Developer Tools panel, and the selection of Security in the main tools row once the panel opens.
Google states that the feature is being rolled out which means that it may not be available yet on all systems. If that is the case run an update check to make sure you are running at least Chrome 48. If that does not help, there is unfortunately not much that you can do at this point but wait until it is enabled for your Chrome version.
The panel is divided into two panes. The left pane displays information about each connection Chrome made while connecting to the site.
It indicates secure connections with green icons, and non-secure connections with different colors, for instance yellow for mixed-content.
The connections are divided into "main origin", which is the site you connected to directly, and "non-secure origins" and "secure origins".
You may also click on any of the links listed on the left to display detailed information about them on the right.
The right side lists additional details such as the certificate used, an option to view the certificate, the strength of the protocol version and cipher suite, and information about mixed content or non-secure content.
Webmasters can use the new Security Overview tool to debug secure connection issues especially since all connections and their states are listed by the tool making it easy to identify the resources that are not loaded via secure connections.
This article was first seen on ComTek's "TekBits" Technology News

- Log in to post comments